
 This topic is locked
Am doing it after shutting down all windows/pages

#47

 Posted 25 May 2019 - 07:12 PM
Hari Prahlad
- Topic Starter
-

- Member
-

- 301 posts
Member
Did as instructed. Laptop considerably faster now.
_________________________________________________________________________________________________________
CONCLUSION
_________________________________________________________________________________________________________
Your system appears to be suitable for handling real-time audio and other tasks without dropouts.
LatencyMon has been analyzing your system for 0:00:31 (h:mm:ss) on all processors.
_________________________________________________________________________________________________________
SYSTEM INFORMATION
_________________________________________________________________________________________________________
Computer name: USER
OS version: Windows 8.1 , 6.3, build: 9600 (x64)
Hardware: Aspire E5-573, Acer, ZORO_BH
CPU: GenuineIntel Intel® Core™ i3-5005U CPU @ 2.00GHz
Logical processors: 4
Processor groups: 1
RAM: 4016 MB total
_________________________________________________________________________________________________________
CPU SPEED
_________________________________________________________________________________________________________
Reported CPU speed: 20 MHz
Note: reported execution times may be calculated based on a fixed reported CPU speed. Disable variable speed settings like Intel Speed Step and AMD Cool N Quiet in the BIOS setup for more accurate results.
_________________________________________________________________________________________________________
MEASURED INTERRUPT TO USER PROCESS LATENCIES
_________________________________________________________________________________________________________
The interrupt to process latency reflects the measured interval that a usermode process needed to respond to a hardware request from the moment the interrupt service routine started execution. This includes the scheduling and execution of a DPC routine, the signaling of an event and the waking up of a usermode thread from an idle wait state in response to that event.
Highest measured interrupt to process latency (µs): 267.775314
Average measured interrupt to process latency (µs): 15.826703
Highest measured interrupt to DPC latency (µs): 188.927516
Average measured interrupt to DPC latency (µs): 2.895163
_________________________________________________________________________________________________________
REPORTED ISRs
_________________________________________________________________________________________________________
Interrupt service routines are routines installed by the OS and device drivers that execute in response to a hardware interrupt signal.
Highest ISR routine execution time (µs): 20.310
Driver with highest ISR routine execution time: hal.dll - Hardware Abstraction Layer DLL, Microsoft Corporation
Highest reported total ISR routine time (%): 0.001440
Driver with highest ISR total time: hal.dll - Hardware Abstraction Layer DLL, Microsoft Corporation
Total time spent in ISRs (%) 0.001913
ISR count (execution time <250 µs): 284
ISR count (execution time 250-500 µs): 0
ISR count (execution time 500-999 µs): 0
ISR count (execution time 1000-1999 µs): 0
ISR count (execution time 2000-3999 µs): 0
ISR count (execution time >=4000 µs): 0
_________________________________________________________________________________________________________
REPORTED DPCs
_________________________________________________________________________________________________________
DPC routines are part of the interrupt servicing dispatch mechanism and disable the possibility for a process to utilize the CPU while it is interrupted until the DPC has finished execution.
Highest DPC routine execution time (µs): 321.020
Driver with highest DPC routine execution time: ndis.sys - Network Driver Interface Specification (NDIS), Microsoft Corporation
Highest reported total DPC routine time (%): 0.024671
Driver with highest DPC total execution time: storport.sys - Microsoft Storage Port Driver, Microsoft Corporation
Total time spent in DPCs (%) 0.075699
DPC count (execution time <250 µs): 11764
DPC count (execution time 250-500 µs): 0
DPC count (execution time 500-999 µs): 2
DPC count (execution time 1000-1999 µs): 0
DPC count (execution time 2000-3999 µs): 0
DPC count (execution time >=4000 µs): 0
_________________________________________________________________________________________________________
REPORTED HARD PAGEFAULTS
_________________________________________________________________________________________________________
Hard pagefaults are events that get triggered by making use of virtual memory that is not resident in RAM but backed by a memory mapped file on disk. The process of resolving the hard pagefault requires reading in the memory from disk while the process is interrupted and blocked from execution.
NOTE: some processes were hit by hard pagefaults. If these were programs producing audio, they are likely to interrupt the audio stream resulting in dropouts, clicks and pops. Check the Processes tab to see which programs were hit.
Process with highest pagefault count: avpui.exe
Total number of hard pagefaults 3822
Hard pagefault count of hardest hit process: 2202
Number of processes hit: 8
_________________________________________________________________________________________________________
PER CPU DATA
_________________________________________________________________________________________________________
CPU 0 Interrupt cycle time (s): 0.188126
CPU 0 ISR highest execution time (µs): 11.2650
CPU 0 ISR total execution time (s): 0.001055
CPU 0 ISR count: 126
CPU 0 DPC highest execution time (µs): 263.3850
CPU 0 DPC total execution time (s): 0.044782
CPU 0 DPC count: 8253
_________________________________________________________________________________________________________
CPU 1 Interrupt cycle time (s): 0.254062
CPU 1 ISR highest execution time (µs): 11.9550
CPU 1 ISR total execution time (s): 0.000439
CPU 1 ISR count: 49
CPU 1 DPC highest execution time (µs): 321.020
CPU 1 DPC total execution time (s): 0.034229
CPU 1 DPC count: 2139
_________________________________________________________________________________________________________
CPU 2 Interrupt cycle time (s): 0.107482
CPU 2 ISR highest execution time (µs): 20.310
CPU 2 ISR total execution time (s): 0.000408
CPU 2 ISR count: 49
CPU 2 DPC highest execution time (µs): 65.530
CPU 2 DPC total execution time (s): 0.005769
CPU 2 DPC count: 503
_________________________________________________________________________________________________________
CPU 3 Interrupt cycle time (s): 0.134890
CPU 3 ISR highest execution time (µs): 11.940
CPU 3 ISR total execution time (s): 0.00050
CPU 3 ISR count: 60
CPU 3 DPC highest execution time (µs): 75.9050
CPU 3 DPC total execution time (s): 0.010268
CPU 3 DPC count: 871
_________________________________________________________________________________________________________
Do I have to delete the programs that you asked me to install?
#48
Posted 26 May 2019 - 04:03 AM
RKinner
-

- Expert
-

- 24,731 posts
Malware Expert
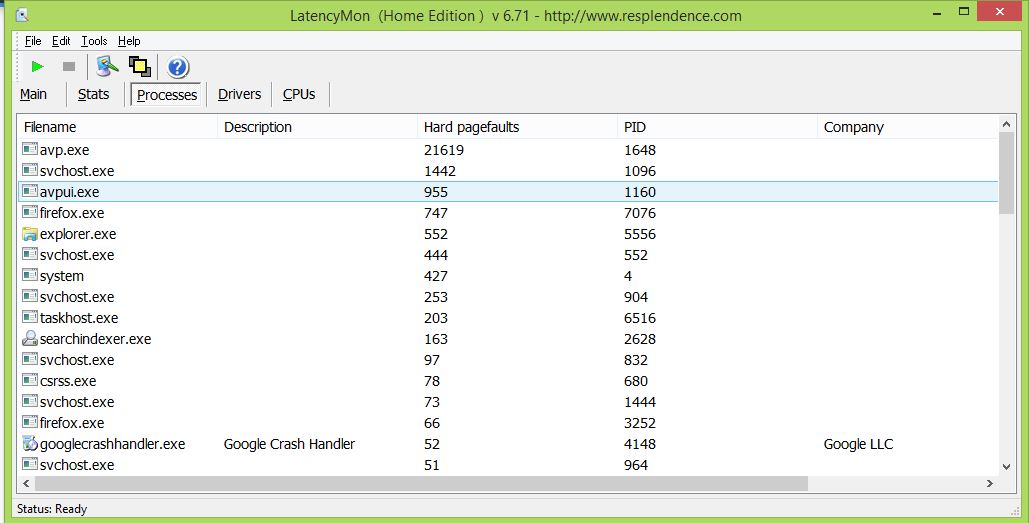
Could you show me the Processes page from Latency Monitor with the PageFaults at the top? You should be able to use the snipping tool (save the file as .jpg then you can attach it to the reply) Probably there is nothing more we can do to stop them other than adding more memory (you only have 4 GB - 8GB is recommended for 64 bit systems- you can use up to 16. Speccy says you have one stick of 4GB and 2 slots so adding a second would be easy. Don't know if you have Amazon over there but they have the exact same (HYNIX HMT451S6BFR8APB) 4GB for $18 You need DDR3L not DDR3) but I want to be sure we are not missing anything.
Also make a new Process Explorer log but first click on the Working Set column header once or twice so the processes with the largest memory use are at the top.
We will uninstall everything as part of the cleanup when done but you can uninstall Speccy now.
#49
Posted 26 May 2019 - 06:56 PM
Hari Prahlad
- Topic Starter
-
- Member
-
- 301 posts
Member
Speccy uninstalled.
Attached Thumbnails
Attached Files
-
 Hardware Interrupts and DPCs.txt 4.49KB
278 downloads
Hardware Interrupts and DPCs.txt 4.49KB
278 downloads
#50
Posted 26 May 2019 - 09:01 PM
RKinner
-
- Expert
-
- 24,731 posts
Malware Expert
I need Latency Monitor's Process page with the Pagefaults sorted to show the worst at the top. Also probably better to run it without Firefox.
#52
Posted 26 May 2019 - 11:00 PM
Hari Prahlad
- Topic Starter
-
- Member
-
- 301 posts
Member
_________________________________________________________________________________________________________
CONCLUSION
_________________________________________________________________________________________________________
Your system seems to be having difficulty handling real-time audio and other tasks. You may experience drop outs, clicks or pops due to buffer underruns. One or more DPC routines that belong to a driver running in your system appear to be executing for too long. One problem may be related to power management, disable CPU throttling settings in Control Panel and BIOS setup. Check for BIOS updates.
LatencyMon has been analyzing your system for 0:01:46 (h:mm:ss) on all processors.
_________________________________________________________________________________________________________
SYSTEM INFORMATION
_________________________________________________________________________________________________________
Computer name: USER
OS version: Windows 8.1 , 6.3, build: 9600 (x64)
Hardware: Aspire E5-573, Acer, ZORO_BH
CPU: GenuineIntel Intel® Core™ i3-5005U CPU @ 2.00GHz
Logical processors: 4
Processor groups: 1
RAM: 4016 MB total
_________________________________________________________________________________________________________
CPU SPEED
_________________________________________________________________________________________________________
Reported CPU speed: 20 MHz
Note: reported execution times may be calculated based on a fixed reported CPU speed. Disable variable speed settings like Intel Speed Step and AMD Cool N Quiet in the BIOS setup for more accurate results.
_________________________________________________________________________________________________________
MEASURED INTERRUPT TO USER PROCESS LATENCIES
_________________________________________________________________________________________________________
The interrupt to process latency reflects the measured interval that a usermode process needed to respond to a hardware request from the moment the interrupt service routine started execution. This includes the scheduling and execution of a DPC routine, the signaling of an event and the waking up of a usermode thread from an idle wait state in response to that event.
Highest measured interrupt to process latency (µs): 1507.836140
Average measured interrupt to process latency (µs): 16.77690
Highest measured interrupt to DPC latency (µs): 1488.892188
Average measured interrupt to DPC latency (µs): 3.462891
_________________________________________________________________________________________________________
REPORTED ISRs
_________________________________________________________________________________________________________
Interrupt service routines are routines installed by the OS and device drivers that execute in response to a hardware interrupt signal.
Highest ISR routine execution time (µs): 174.5950
Driver with highest ISR routine execution time: hal.dll - Hardware Abstraction Layer DLL, Microsoft Corporation
Highest reported total ISR routine time (%): 0.011231
Driver with highest ISR total time: hal.dll - Hardware Abstraction Layer DLL, Microsoft Corporation
Total time spent in ISRs (%) 0.015932
ISR count (execution time <250 µs): 8408
ISR count (execution time 250-500 µs): 0
ISR count (execution time 500-999 µs): 0
ISR count (execution time 1000-1999 µs): 0
ISR count (execution time 2000-3999 µs): 0
ISR count (execution time >=4000 µs): 0
_________________________________________________________________________________________________________
REPORTED DPCs
_________________________________________________________________________________________________________
DPC routines are part of the interrupt servicing dispatch mechanism and disable the possibility for a process to utilize the CPU while it is interrupted until the DPC has finished execution.
Highest DPC routine execution time (µs): 1567.410
Driver with highest DPC routine execution time: tcpip.sys - TCP/IP Driver, Microsoft Corporation
Highest reported total DPC routine time (%): 0.031021
Driver with highest DPC total execution time: Wdf01000.sys - Kernel Mode Driver Framework Runtime, Microsoft Corporation
Total time spent in DPCs (%) 0.096408
DPC count (execution time <250 µs): 37000
DPC count (execution time 250-500 µs): 0
DPC count (execution time 500-999 µs): 22
DPC count (execution time 1000-1999 µs): 2
DPC count (execution time 2000-3999 µs): 0
DPC count (execution time >=4000 µs): 0
_________________________________________________________________________________________________________
REPORTED HARD PAGEFAULTS
_________________________________________________________________________________________________________
Hard pagefaults are events that get triggered by making use of virtual memory that is not resident in RAM but backed by a memory mapped file on disk. The process of resolving the hard pagefault requires reading in the memory from disk while the process is interrupted and blocked from execution.
NOTE: some processes were hit by hard pagefaults. If these were programs producing audio, they are likely to interrupt the audio stream resulting in dropouts, clicks and pops. Check the Processes tab to see which programs were hit.
Process with highest pagefault count: avp.exe
Total number of hard pagefaults 2037
Hard pagefault count of hardest hit process: 997
Number of processes hit: 7
_________________________________________________________________________________________________________
PER CPU DATA
_________________________________________________________________________________________________________
CPU 0 Interrupt cycle time (s): 0.606474
CPU 0 ISR highest execution time (µs): 21.380
CPU 0 ISR total execution time (s): 0.009820
CPU 0 ISR count: 1236
CPU 0 DPC highest execution time (µs): 283.5050
CPU 0 DPC total execution time (s): 0.090287
CPU 0 DPC count: 15278
_________________________________________________________________________________________________________
CPU 1 Interrupt cycle time (s): 0.967409
CPU 1 ISR highest execution time (µs): 40.5250
CPU 1 ISR total execution time (s): 0.019445
CPU 1 ISR count: 2270
CPU 1 DPC highest execution time (µs): 1464.810
CPU 1 DPC total execution time (s): 0.115824
CPU 1 DPC count: 7414
_________________________________________________________________________________________________________
CPU 2 Interrupt cycle time (s): 0.854053
CPU 2 ISR highest execution time (µs): 174.5950
CPU 2 ISR total execution time (s): 0.030109
CPU 2 ISR count: 3898
CPU 2 DPC highest execution time (µs): 205.9750
CPU 2 DPC total execution time (s): 0.117114
CPU 2 DPC count: 8228
_________________________________________________________________________________________________________
CPU 3 Interrupt cycle time (s): 0.603511
CPU 3 ISR highest execution time (µs): 40.7250
CPU 3 ISR total execution time (s): 0.008367
CPU 3 ISR count: 1004
CPU 3 DPC highest execution time (µs): 1567.410
CPU 3 DPC total execution time (s): 0.086692
CPU 3 DPC count: 6104
_________________________________________________________________________________________________________
#53
Posted 27 May 2019 - 04:43 AM
RKinner
-
- Expert
-
- 24,731 posts
Malware Expert
No what I want is the PROCESSES page: Looks like this:

My PC has no page faults (has 8 GB RAM) but remember to click on Hard Pagefaults column header once or twice to get the biggest numbers at the top before taking the screenshot.
#54
Posted 27 May 2019 - 06:49 AM
Hari Prahlad
- Topic Starter
-
- Member
-
- 301 posts
Member
Got it. Will run it again
#55
Posted 27 May 2019 - 06:59 AM
Hari Prahlad
- Topic Starter
-
- Member
-
- 301 posts
Member
_________________________________________________________________________________________________________
CONCLUSION
_________________________________________________________________________________________________________
Your system appears to be suitable for handling real-time audio and other tasks without dropouts.
LatencyMon has been analyzing your system for 0:00:31 (h:mm:ss) on all processors.
_________________________________________________________________________________________________________
SYSTEM INFORMATION
_________________________________________________________________________________________________________
Computer name: USER
OS version: Windows 8.1 , 6.3, build: 9600 (x64)
Hardware: Aspire E5-573, Acer, ZORO_BH
CPU: GenuineIntel Intel® Core™ i3-5005U CPU @ 2.00GHz
Logical processors: 4
Processor groups: 1
RAM: 4016 MB total
_________________________________________________________________________________________________________
CPU SPEED
_________________________________________________________________________________________________________
Reported CPU speed: 20 MHz
Note: reported execution times may be calculated based on a fixed reported CPU speed. Disable variable speed settings like Intel Speed Step and AMD Cool N Quiet in the BIOS setup for more accurate results.
_________________________________________________________________________________________________________
MEASURED INTERRUPT TO USER PROCESS LATENCIES
_________________________________________________________________________________________________________
The interrupt to process latency reflects the measured interval that a usermode process needed to respond to a hardware request from the moment the interrupt service routine started execution. This includes the scheduling and execution of a DPC routine, the signaling of an event and the waking up of a usermode thread from an idle wait state in response to that event.
Highest measured interrupt to process latency (µs): 377.343034
Average measured interrupt to process latency (µs): 17.256658
Highest measured interrupt to DPC latency (µs): 82.431789
Average measured interrupt to DPC latency (µs): 3.017941
_________________________________________________________________________________________________________
REPORTED ISRs
_________________________________________________________________________________________________________
Interrupt service routines are routines installed by the OS and device drivers that execute in response to a hardware interrupt signal.
Highest ISR routine execution time (µs): 18.350
Driver with highest ISR routine execution time: hal.dll - Hardware Abstraction Layer DLL, Microsoft Corporation
Highest reported total ISR routine time (%): 0.001619
Driver with highest ISR total time: hal.dll - Hardware Abstraction Layer DLL, Microsoft Corporation
Total time spent in ISRs (%) 0.002084
ISR count (execution time <250 µs): 330
ISR count (execution time 250-500 µs): 0
ISR count (execution time 500-999 µs): 0
ISR count (execution time 1000-1999 µs): 0
ISR count (execution time 2000-3999 µs): 0
ISR count (execution time >=4000 µs): 0
_________________________________________________________________________________________________________
REPORTED DPCs
_________________________________________________________________________________________________________
DPC routines are part of the interrupt servicing dispatch mechanism and disable the possibility for a process to utilize the CPU while it is interrupted until the DPC has finished execution.
Highest DPC routine execution time (µs): 257.70
Driver with highest DPC routine execution time: Wdf01000.sys - Kernel Mode Driver Framework Runtime, Microsoft Corporation
Highest reported total DPC routine time (%): 0.017555
Driver with highest DPC total execution time: rspLLL64.sys - Resplendence Latency Monitoring and Auxiliary Kernel Library, Resplendence Software Projects Sp.
Total time spent in DPCs (%) 0.034692
DPC count (execution time <250 µs): 9436
DPC count (execution time 250-500 µs): 0
DPC count (execution time 500-999 µs): 1
DPC count (execution time 1000-1999 µs): 0
DPC count (execution time 2000-3999 µs): 0
DPC count (execution time >=4000 µs): 0
_________________________________________________________________________________________________________
REPORTED HARD PAGEFAULTS
_________________________________________________________________________________________________________
Hard pagefaults are events that get triggered by making use of virtual memory that is not resident in RAM but backed by a memory mapped file on disk. The process of resolving the hard pagefault requires reading in the memory from disk while the process is interrupted and blocked from execution.
Process with highest pagefault count: none
Total number of hard pagefaults 0
Hard pagefault count of hardest hit process: 0
Number of processes hit: 0
_________________________________________________________________________________________________________
PER CPU DATA
_________________________________________________________________________________________________________
CPU 0 Interrupt cycle time (s): 0.105735
CPU 0 ISR highest execution time (µs): 18.350
CPU 0 ISR total execution time (s): 0.000673
CPU 0 ISR count: 102
CPU 0 DPC highest execution time (µs): 257.70
CPU 0 DPC total execution time (s): 0.030440
CPU 0 DPC count: 8504
_________________________________________________________________________________________________________
CPU 1 Interrupt cycle time (s): 0.195983
CPU 1 ISR highest execution time (µs): 13.530
CPU 1 ISR total execution time (s): 0.001350
CPU 1 ISR count: 157
CPU 1 DPC highest execution time (µs): 244.980
CPU 1 DPC total execution time (s): 0.010365
CPU 1 DPC count: 733
_________________________________________________________________________________________________________
CPU 2 Interrupt cycle time (s): 0.092733
CPU 2 ISR highest execution time (µs): 11.6550
CPU 2 ISR total execution time (s): 0.000330
CPU 2 ISR count: 42
CPU 2 DPC highest execution time (µs): 63.4150
CPU 2 DPC total execution time (s): 0.002139
CPU 2 DPC count: 156
_________________________________________________________________________________________________________
CPU 3 Interrupt cycle time (s): 0.114913
CPU 3 ISR highest execution time (µs): 10.350
CPU 3 ISR total execution time (s): 0.000268
CPU 3 ISR count: 29
CPU 3 DPC highest execution time (µs): 47.070
CPU 3 DPC total execution time (s): 0.000682
CPU 3 DPC count: 44
_________________________________________________________________________________________________________
#57
Posted 27 May 2019 - 09:55 AM
RKinner
-
- Expert
-
- 24,731 posts
Malware Expert
No. After running Latency Monitor, click on the Processes Tab then on the Hard Pagefault column header. (Click a second time if you need to to get the big numbers at the top.)
#58
Posted 27 May 2019 - 06:30 PM
Hari Prahlad
- Topic Starter
-
- Member
-
- 301 posts
Member
Is this okay?
_________________________________________________________________________________________________________
CONCLUSION
_________________________________________________________________________________________________________
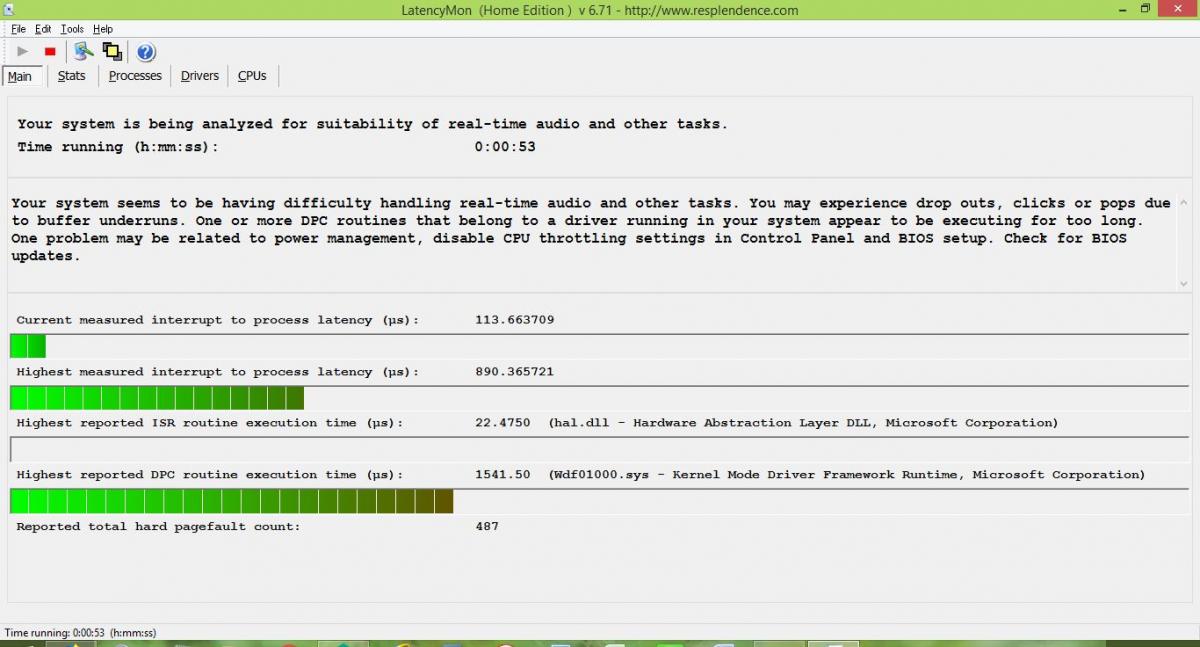
Your system seems to be having difficulty handling real-time audio and other tasks. You may experience drop outs, clicks or pops due to buffer underruns. One or more DPC routines that belong to a driver running in your system appear to be executing for too long. One problem may be related to power management, disable CPU throttling settings in Control Panel and BIOS setup. Check for BIOS updates.
LatencyMon has been analyzing your system for 0:00:22 (h:mm:ss) on all processors.
_________________________________________________________________________________________________________
SYSTEM INFORMATION
_________________________________________________________________________________________________________
Computer name: USER
OS version: Windows 8.1 , 6.3, build: 9600 (x64)
Hardware: Aspire E5-573, Acer, ZORO_BH
CPU: GenuineIntel Intel® Core™ i3-5005U CPU @ 2.00GHz
Logical processors: 4
Processor groups: 1
RAM: 4016 MB total
_________________________________________________________________________________________________________
CPU SPEED
_________________________________________________________________________________________________________
Reported CPU speed: 20 MHz
Note: reported execution times may be calculated based on a fixed reported CPU speed. Disable variable speed settings like Intel Speed Step and AMD Cool N Quiet in the BIOS setup for more accurate results.
_________________________________________________________________________________________________________
MEASURED INTERRUPT TO USER PROCESS LATENCIES
_________________________________________________________________________________________________________
The interrupt to process latency reflects the measured interval that a usermode process needed to respond to a hardware request from the moment the interrupt service routine started execution. This includes the scheduling and execution of a DPC routine, the signaling of an event and the waking up of a usermode thread from an idle wait state in response to that event.
Highest measured interrupt to process latency (µs): 524.286658
Average measured interrupt to process latency (µs): 15.876457
Highest measured interrupt to DPC latency (µs): 516.606677
Average measured interrupt to DPC latency (µs): 3.901008
_________________________________________________________________________________________________________
REPORTED ISRs
_________________________________________________________________________________________________________
Interrupt service routines are routines installed by the OS and device drivers that execute in response to a hardware interrupt signal.
Highest ISR routine execution time (µs): 10.680
Driver with highest ISR routine execution time: hal.dll - Hardware Abstraction Layer DLL, Microsoft Corporation
Highest reported total ISR routine time (%): 0.001422
Driver with highest ISR total time: Wdf01000.sys - Kernel Mode Driver Framework Runtime, Microsoft Corporation
Total time spent in ISRs (%) 0.002263
ISR count (execution time <250 µs): 369
ISR count (execution time 250-500 µs): 0
ISR count (execution time 500-999 µs): 0
ISR count (execution time 1000-1999 µs): 0
ISR count (execution time 2000-3999 µs): 0
ISR count (execution time >=4000 µs): 0
_________________________________________________________________________________________________________
REPORTED DPCs
_________________________________________________________________________________________________________
DPC routines are part of the interrupt servicing dispatch mechanism and disable the possibility for a process to utilize the CPU while it is interrupted until the DPC has finished execution.
Highest DPC routine execution time (µs): 1256.4250
Driver with highest DPC routine execution time: Wdf01000.sys - Kernel Mode Driver Framework Runtime, Microsoft Corporation
Highest reported total DPC routine time (%): 0.056324
Driver with highest DPC total execution time: Wdf01000.sys - Kernel Mode Driver Framework Runtime, Microsoft Corporation
Total time spent in DPCs (%) 0.111887
DPC count (execution time <250 µs): 5287
DPC count (execution time 250-500 µs): 0
DPC count (execution time 500-999 µs): 85
DPC count (execution time 1000-1999 µs): 2
DPC count (execution time 2000-3999 µs): 0
DPC count (execution time >=4000 µs): 0
_________________________________________________________________________________________________________
REPORTED HARD PAGEFAULTS
_________________________________________________________________________________________________________
Hard pagefaults are events that get triggered by making use of virtual memory that is not resident in RAM but backed by a memory mapped file on disk. The process of resolving the hard pagefault requires reading in the memory from disk while the process is interrupted and blocked from execution.
NOTE: some processes were hit by hard pagefaults. If these were programs producing audio, they are likely to interrupt the audio stream resulting in dropouts, clicks and pops. Check the Processes tab to see which programs were hit.
Process with highest pagefault count: firefox.exe
Total number of hard pagefaults 216
Hard pagefault count of hardest hit process: 125
Number of processes hit: 3
_________________________________________________________________________________________________________
PER CPU DATA
_________________________________________________________________________________________________________
CPU 0 Interrupt cycle time (s): 0.258195
CPU 0 ISR highest execution time (µs): 10.580
CPU 0 ISR total execution time (s): 0.000756
CPU 0 ISR count: 180
CPU 0 DPC highest execution time (µs): 1256.4250
CPU 0 DPC total execution time (s): 0.057573
CPU 0 DPC count: 3435
_________________________________________________________________________________________________________
CPU 1 Interrupt cycle time (s): 0.179527
CPU 1 ISR highest execution time (µs): 4.780
CPU 1 ISR total execution time (s): 0.000111
CPU 1 ISR count: 27
CPU 1 DPC highest execution time (µs): 621.7850
CPU 1 DPC total execution time (s): 0.017154
CPU 1 DPC count: 836
_________________________________________________________________________________________________________
CPU 2 Interrupt cycle time (s): 0.082669
CPU 2 ISR highest execution time (µs): 10.680
CPU 2 ISR total execution time (s): 0.001059
CPU 2 ISR count: 140
CPU 2 DPC highest execution time (µs): 67.780
CPU 2 DPC total execution time (s): 0.004706
CPU 2 DPC count: 316
_________________________________________________________________________________________________________
CPU 3 Interrupt cycle time (s): 0.141549
CPU 3 ISR highest execution time (µs): 8.3750
CPU 3 ISR total execution time (s): 0.000092
CPU 3 ISR count: 22
CPU 3 DPC highest execution time (µs): 1122.70
CPU 3 DPC total execution time (s): 0.020285
CPU 3 DPC count: 787
_________________________________________________________________________________________________________
#59
Posted 27 May 2019 - 08:24 PM
Hari Prahlad
- Topic Starter
-
- Member
-
- 301 posts
Member
_________________________________________________________________________________________________________
CONCLUSION
_________________________________________________________________________________________________________
Your system seems to be having difficulty handling real-time audio and other tasks. You may experience drop outs, clicks or pops due to buffer underruns. One or more DPC routines that belong to a driver running in your system appear to be executing for too long. One problem may be related to power management, disable CPU throttling settings in Control Panel and BIOS setup. Check for BIOS updates.
LatencyMon has been analyzing your system for 0:00:22 (h:mm:ss) on all processors.
_________________________________________________________________________________________________________
SYSTEM INFORMATION
_________________________________________________________________________________________________________
Computer name: USER
OS version: Windows 8.1 , 6.3, build: 9600 (x64)
Hardware: Aspire E5-573, Acer, ZORO_BH
CPU: GenuineIntel Intel® Core™ i3-5005U CPU @ 2.00GHz
Logical processors: 4
Processor groups: 1
RAM: 4016 MB total
_________________________________________________________________________________________________________
CPU SPEED
_________________________________________________________________________________________________________
Reported CPU speed: 20 MHz
Note: reported execution times may be calculated based on a fixed reported CPU speed. Disable variable speed settings like Intel Speed Step and AMD Cool N Quiet in the BIOS setup for more accurate results.
_________________________________________________________________________________________________________
MEASURED INTERRUPT TO USER PROCESS LATENCIES
_________________________________________________________________________________________________________
The interrupt to process latency reflects the measured interval that a usermode process needed to respond to a hardware request from the moment the interrupt service routine started execution. This includes the scheduling and execution of a DPC routine, the signaling of an event and the waking up of a usermode thread from an idle wait state in response to that event.
Highest measured interrupt to process latency (µs): 524.286658
Average measured interrupt to process latency (µs): 15.876457
Highest measured interrupt to DPC latency (µs): 516.606677
Average measured interrupt to DPC latency (µs): 3.901008
_________________________________________________________________________________________________________
REPORTED ISRs
_________________________________________________________________________________________________________
Interrupt service routines are routines installed by the OS and device drivers that execute in response to a hardware interrupt signal.
Highest ISR routine execution time (µs): 10.680
Driver with highest ISR routine execution time: hal.dll - Hardware Abstraction Layer DLL, Microsoft Corporation
Highest reported total ISR routine time (%): 0.001422
Driver with highest ISR total time: Wdf01000.sys - Kernel Mode Driver Framework Runtime, Microsoft Corporation
Total time spent in ISRs (%) 0.002263
ISR count (execution time <250 µs): 369
ISR count (execution time 250-500 µs): 0
ISR count (execution time 500-999 µs): 0
ISR count (execution time 1000-1999 µs): 0
ISR count (execution time 2000-3999 µs): 0
ISR count (execution time >=4000 µs): 0
_________________________________________________________________________________________________________
REPORTED DPCs
_________________________________________________________________________________________________________
DPC routines are part of the interrupt servicing dispatch mechanism and disable the possibility for a process to utilize the CPU while it is interrupted until the DPC has finished execution.
Highest DPC routine execution time (µs): 1256.4250
Driver with highest DPC routine execution time: Wdf01000.sys - Kernel Mode Driver Framework Runtime, Microsoft Corporation
Highest reported total DPC routine time (%): 0.056324
Driver with highest DPC total execution time: Wdf01000.sys - Kernel Mode Driver Framework Runtime, Microsoft Corporation
Total time spent in DPCs (%) 0.111887
DPC count (execution time <250 µs): 5287
DPC count (execution time 250-500 µs): 0
DPC count (execution time 500-999 µs): 85
DPC count (execution time 1000-1999 µs): 2
DPC count (execution time 2000-3999 µs): 0
DPC count (execution time >=4000 µs): 0
_________________________________________________________________________________________________________
REPORTED HARD PAGEFAULTS
_________________________________________________________________________________________________________
Hard pagefaults are events that get triggered by making use of virtual memory that is not resident in RAM but backed by a memory mapped file on disk. The process of resolving the hard pagefault requires reading in the memory from disk while the process is interrupted and blocked from execution.
NOTE: some processes were hit by hard pagefaults. If these were programs producing audio, they are likely to interrupt the audio stream resulting in dropouts, clicks and pops. Check the Processes tab to see which programs were hit.
Process with highest pagefault count: firefox.exe
Total number of hard pagefaults 216
Hard pagefault count of hardest hit process: 125
Number of processes hit: 3
_________________________________________________________________________________________________________
PER CPU DATA
_________________________________________________________________________________________________________
CPU 0 Interrupt cycle time (s): 0.258195
CPU 0 ISR highest execution time (µs): 10.580
CPU 0 ISR total execution time (s): 0.000756
CPU 0 ISR count: 180
CPU 0 DPC highest execution time (µs): 1256.4250
CPU 0 DPC total execution time (s): 0.057573
CPU 0 DPC count: 3435
_________________________________________________________________________________________________________
CPU 1 Interrupt cycle time (s): 0.179527
CPU 1 ISR highest execution time (µs): 4.780
CPU 1 ISR total execution time (s): 0.000111
CPU 1 ISR count: 27
CPU 1 DPC highest execution time (µs): 621.7850
CPU 1 DPC total execution time (s): 0.017154
CPU 1 DPC count: 836
_________________________________________________________________________________________________________
CPU 2 Interrupt cycle time (s): 0.082669
CPU 2 ISR highest execution time (µs): 10.680
CPU 2 ISR total execution time (s): 0.001059
CPU 2 ISR count: 140
CPU 2 DPC highest execution time (µs): 67.780
CPU 2 DPC total execution time (s): 0.004706
CPU 2 DPC count: 316
_________________________________________________________________________________________________________
CPU 3 Interrupt cycle time (s): 0.141549
CPU 3 ISR highest execution time (µs): 8.3750
CPU 3 ISR total execution time (s): 0.000092
CPU 3 ISR count: 22
CPU 3 DPC highest execution time (µs): 1122.70
CPU 3 DPC total execution time (s): 0.020285
CPU 3 DPC count: 787
_________________________________________________________________________________________________________
#60
Posted 27 May 2019 - 08:27 PM
Hari Prahlad
- Topic Starter
-
- Member
-
- 301 posts
Member
I hope this is okay
Attached Thumbnails


Similar Topics
Also tagged with one or more of these keywords: Hanging, Malware

|
Security →
Virus, Spyware, Malware Removal →
rooted unable to restoreStarted by b8nk1028 , 26 Apr 2025 |
|

|
|
|
|
Hardware →
Smartphones and Tablets →
Samsung personal smartphones - hackingStarted by Cremebrulee54 , 26 Jan 2025 |
|

|
|

|
Security →
Virus, Spyware, Malware Removal →
personal laptop showing unauthorized activity [Solved]Started by Cremebrulee54 , 21 Jan 2025 |
|
![personal laptop showing unauthorized activity [Solved] - last post by DR M](https://www.geekstogo.com/forum/uploads/profile/photo-418842.gif?_r=1578338641)
|
|
|
|
Security →
Virus, Spyware, Malware Removal →
Lingering Windows Script Host errors [Closed]Started by LegionXIX , 21 Aug 2024 |
|
|
|
|
|
Security →
Virus, Spyware, Malware Removal →
Possible Malware infection - help request [Solved]Started by Maffu , 07 May 2023 |
|
|
1 user(s) are reading this topic
0 members, 1 guests, 0 anonymous users
As Featured On:


 Sign In
 Create Account
