
As my PM to you please.

Windows XP Blue Screen of Death STOP Codes
Started by
cheathawk1
, Jul 12 2005 11:51 AM
#121

 Posted 26 August 2011 - 03:40 PM
Macboatmaster
-

- Member
-

- 7,237 posts
7k
As my PM to you please.

#122
Posted 28 August 2011 - 07:39 AM
Tia Beth Young
-

- Member
-
- 2 posts
New Member
I think it is my Mom's hard drive. I'll be installing another one & oh yeah.... I'm installing Kubuntu for her so no more BSoD! Thanks all!BSoD!STOP: 0x00000024 (0x00190203, 0x89B79AC0, 0xC0000102, 0x00000000) STOP: 0x00000024 (0x00190203, 0x89B523D8, 0xC0000102, 0x00000000) Hi everyone. I need some help if possible, please? I'm tryin 2 fix my Mom's PC. It's a Gateway. I don't have her XP disc cause she doesn't have it. I have mine but my PC is a Dell. Any help would be greatly appreciated! I have her desk top next to mine so I can work on it. I can't get it to load anything.... no safe mode blah blah! Please help!

#123
Posted 28 August 2011 - 08:04 PM
Sean Horner
-

- Member
-
- 1 posts
New Member
STOP 0X0000008E (0XE000000), 0XB8430925, 0XB739D8B8, 0X0000000
WATCHDOG.SYS B8430925 BASE AT B8430000, DATE... 480254AB
Please help! Also, whenever I try to upgrade to WIN 7, near the end of the installation, I get this BSOD and I have to roll back.
I have Windows XP SP3
WATCHDOG.SYS B8430925 BASE AT B8430000, DATE... 480254AB
Please help! Also, whenever I try to upgrade to WIN 7, near the end of the installation, I get this BSOD and I have to roll back.
I have Windows XP SP3
Edited by Sean Horner, 29 August 2011 - 12:04 PM.
#124
Posted 29 August 2011 - 11:19 AM
Macboatmaster
-
- Member
-
- 7,237 posts
7k
PM sent to Sean Horner re post in this thread.
#125
Posted 27 March 2012 - 01:34 PM
Mase09
-

- Member
-
- 1 posts
New Member
I have error code that i dont know what to do... PLEASE HELP THIS COMPUTER HAS ALLLLLL MY SCHOOL WORK ON IT!!!
Technical information:
*** STOP: 0x000000ED (0x8653F900, 0xC0000006, 0x00000000, 0x00000000)
i've tried safe modes (all of them -_-") and i still have no luck.
Technical information:
*** STOP: 0x000000ED (0x8653F900, 0xC0000006, 0x00000000, 0x00000000)
i've tried safe modes (all of them -_-") and i still have no luck.

#127
Posted 12 April 2012 - 02:46 AM
fielkun
-

- Member
-
- 17 posts
Member
I've been having the same problem as well. Everytime I boot up my computer, it would take several minutes before it crashes into a blue screen saying that thing "DRIVER IRQL NOT LESS OR EQUAL" and after I restarted my pc, a message would appear saying my pc has recovered from serious error. Then after that, I can use my pc for longer hours but with random freezing every now and then.
My OS is Microsoft Win XP Professional 32 bit
My OS is Microsoft Win XP Professional 32 bit
Edited by Macboatmaster, 12 April 2012 - 12:12 PM.
#128
Posted 12 April 2012 - 12:16 PM
Macboatmaster
-
- Member
-
- 7,237 posts
7k
fielkun
Welcome to Geeks to Go
I have replied to your topic also posted here on the link below
http://www.geekstogo...-less-or-equal/
This topic is an advice topic on Stop Codes.
When you want help, you always start your own topic.
Do not worry about it now, please proceed on your other thread.
For your future information please only post the problem ONCE
Thank you
#129
Posted 15 May 2012 - 06:24 AM
frank...
-

- Member
-
- 1 posts
New Member
A have same problem with blue screen on my winXP. There is log from MinuDump. Can someone help me tu find out, what kind of software or hardare can do this issue?
Microsoft ® Windows Debugger Version 6.2.8229.0 AMD64
Copyright © Microsoft Corporation. All rights reserved.
Loading Dump File [C:\Users\nunvar\Documents\ME\České dráhy\MiniDump\Mini040912-03.dmp]
Mini Kernel Dump File: Only registers and stack trace are available
Symbol search path is: *** Invalid ***
****************************************************************************
* Symbol loading may be unreliable without a symbol search path. *
* Use .symfix to have the debugger choose a symbol path. *
* After setting your symbol path, use .reload to refresh symbol locations. *
****************************************************************************
Executable search path is:
*********************************************************************
* Symbols can not be loaded because symbol path is not initialized. *
* *
* The Symbol Path can be set by: *
* using the _NT_SYMBOL_PATH environment variable. *
* using the -y <symbol_path> argument when starting the debugger. *
* using .sympath and .sympath+ *
*********************************************************************
Unable to load image ntoskrnl.exe, Win32 error 0n2
*** WARNING: Unable to verify timestamp for ntoskrnl.exe
*** ERROR: Module load completed but symbols could not be loaded for ntoskrnl.exe
Windows XP Kernel Version 2600 (Service Pack 3) UP Free x86 compatible
Product: WinNt, suite: TerminalServer EmbeddedNT SingleUserTS
Machine Name:
Kernel base = 0x804d7000 PsLoadedModuleList = 0x8055b240
Debug session time: Mon Apr 9 07:27:38.656 2012 (UTC + 2:00)
System Uptime: 0 days 0:52:40.984
*********************************************************************
* Symbols can not be loaded because symbol path is not initialized. *
* *
* The Symbol Path can be set by: *
* using the _NT_SYMBOL_PATH environment variable. *
* using the -y <symbol_path> argument when starting the debugger. *
* using .sympath and .sympath+ *
*********************************************************************
Unable to load image ntoskrnl.exe, Win32 error 0n2
*** WARNING: Unable to verify timestamp for ntoskrnl.exe
*** ERROR: Module load completed but symbols could not be loaded for ntoskrnl.exe
Loading Kernel Symbols
...............................................................
..................................................
Loading User Symbols
Loading unloaded module list
...........
TRIAGER: Could not open triage file : C:\Program Files (x86)\Windows Kits\8.0\Debuggers\x64\triage\oca.ini, error 2
TRIAGER: Could not open triage file : C:\Program Files (x86)\Windows Kits\8.0\Debuggers\x64\winxp\triage.ini, error 2
Unable to load image win32k.sys, Win32 error 0n2
*** WARNING: Unable to verify timestamp for win32k.sys
*** ERROR: Module load completed but symbols could not be loaded for win32k.sys
*******************************************************************************
* *
* Bugcheck Analysis *
* *
*******************************************************************************
Use !analyze -v to get detailed debugging information.
BugCheck 10000050, {ffffffcc, 1, bf813cf4, 0}
***** Kernel symbols are WRONG. Please fix symbols to do analysis.
TRIAGER: Could not open triage file : C:\Program Files (x86)\Windows Kits\8.0\Debuggers\x64\triage\modclass.ini, error 2
*************************************************************************
*** ***
*** ***
*** Either you specified an unqualified symbol, or your debugger ***
*** doesn't have full symbol information. Unqualified symbol ***
*** resolution is turned off by default. Please either specify a ***
*** fully qualified symbol module!symbolname, or enable resolution ***
*** of unqualified symbols by typing ".symopt- 100". Note that ***
*** enabling unqualified symbol resolution with network symbol ***
*** server shares in the symbol path may cause the debugger to ***
*** appear to hang for long periods of time when an incorrect ***
*** symbol name is typed or the network symbol server is down. ***
*** ***
*** For some commands to work properly, your symbol path ***
*** must point to .pdb files that have full type information. ***
*** ***
*** Certain .pdb files (such as the public OS symbols) do not ***
*** contain the required information. Contact the group that ***
*** provided you with these symbols if you need this command to ***
*** work. ***
*** ***
*** Type referenced: nt!_KPRCB ***
*** ***
*************************************************************************
*************************************************************************
*** ***
*** ***
*** Either you specified an unqualified symbol, or your debugger ***
*** doesn't have full symbol information. Unqualified symbol ***
*** resolution is turned off by default. Please either specify a ***
*** fully qualified symbol module!symbolname, or enable resolution ***
*** of unqualified symbols by typing ".symopt- 100". Note that ***
*** enabling unqualified symbol resolution with network symbol ***
*** server shares in the symbol path may cause the debugger to ***
*** appear to hang for long periods of time when an incorrect ***
*** symbol name is typed or the network symbol server is down. ***
*** ***
*** For some commands to work properly, your symbol path ***
*** must point to .pdb files that have full type information. ***
*** ***
*** Certain .pdb files (such as the public OS symbols) do not ***
*** contain the required information. Contact the group that ***
*** provided you with these symbols if you need this command to ***
*** work. ***
*** ***
*** Type referenced: nt!_KPRCB ***
*** ***
*************************************************************************
Probably caused by : win32k.sys ( win32k+13cf4 )
Followup: MachineOwner
---------
kd> !analyze -v
*******************************************************************************
* *
* Bugcheck Analysis *
* *
*******************************************************************************
PAGE_FAULT_IN_NONPAGED_AREA (50)
Invalid system memory was referenced. This cannot be protected by try-except,
it must be protected by a Probe. Typically the address is just plain bad or it
is pointing at freed memory.
Arguments:
Arg1: ffffffcc, memory referenced.
Arg2: 00000001, value 0 = read operation, 1 = write operation.
Arg3: bf813cf4, If non-zero, the instruction address which referenced the bad memory
address.
Arg4: 00000000, (reserved)
Debugging Details:
------------------
***** Kernel symbols are WRONG. Please fix symbols to do analysis.
TRIAGER: Could not open triage file : C:\Program Files (x86)\Windows Kits\8.0\Debuggers\x64\triage\modclass.ini, error 2
*************************************************************************
*** ***
*** ***
*** Either you specified an unqualified symbol, or your debugger ***
*** doesn't have full symbol information. Unqualified symbol ***
*** resolution is turned off by default. Please either specify a ***
*** fully qualified symbol module!symbolname, or enable resolution ***
*** of unqualified symbols by typing ".symopt- 100". Note that ***
*** enabling unqualified symbol resolution with network symbol ***
*** server shares in the symbol path may cause the debugger to ***
*** appear to hang for long periods of time when an incorrect ***
*** symbol name is typed or the network symbol server is down. ***
*** ***
*** For some commands to work properly, your symbol path ***
*** must point to .pdb files that have full type information. ***
*** ***
*** Certain .pdb files (such as the public OS symbols) do not ***
*** contain the required information. Contact the group that ***
*** provided you with these symbols if you need this command to ***
*** work. ***
*** ***
*** Type referenced: nt!_KPRCB ***
*** ***
*************************************************************************
*************************************************************************
*** ***
*** ***
*** Either you specified an unqualified symbol, or your debugger ***
*** doesn't have full symbol information. Unqualified symbol ***
*** resolution is turned off by default. Please either specify a ***
*** fully qualified symbol module!symbolname, or enable resolution ***
*** of unqualified symbols by typing ".symopt- 100". Note that ***
*** enabling unqualified symbol resolution with network symbol ***
*** server shares in the symbol path may cause the debugger to ***
*** appear to hang for long periods of time when an incorrect ***
*** symbol name is typed or the network symbol server is down. ***
*** ***
*** For some commands to work properly, your symbol path ***
*** must point to .pdb files that have full type information. ***
*** ***
*** Certain .pdb files (such as the public OS symbols) do not ***
*** contain the required information. Contact the group that ***
*** provided you with these symbols if you need this command to ***
*** work. ***
*** ***
*** Type referenced: nt!_KPRCB ***
*** ***
*************************************************************************
ADDITIONAL_DEBUG_TEXT:
Use '!findthebuild' command to search for the target build information.
If the build information is available, run '!findthebuild -s ; .reload' to set symbol path and load symbols.
MODULE_NAME: win32k
FAULTING_MODULE: 804d7000 nt
DEBUG_FLR_IMAGE_TIMESTAMP: 4e661f2d
WRITE_ADDRESS: unable to get nt!MmSpecialPoolStart
unable to get nt!MmSpecialPoolEnd
unable to get nt!MmPagedPoolEnd
unable to get nt!MmNonPagedPoolStart
unable to get nt!MmSizeOfNonPagedPoolInBytes
ffffffcc
FAULTING_IP:
win32k+13cf4
bf813cf4 8975cc mov dword ptr [ebp-34h],esi
MM_INTERNAL_CODE: 0
CUSTOMER_CRASH_COUNT: 3
DEFAULT_BUCKET_ID: DRIVER_FAULT
BUGCHECK_STR: 0x50
LAST_CONTROL_TRANSFER: from bf813ef4 to bf813cf4
STACK_TEXT:
WARNING: Stack unwind information not available. Following frames may be wrong.
f7852c04 bf813ef4 bbe35d28 00000002 00000000 win32k+0x13cf4
f7852c4c bf8140e6 02e35d28 00000002 00000000 win32k+0x13ef4
f7852c98 bf80ec89 bbe35d28 00000002 00000000 win32k+0x140e6
f7852cbc bf844fe8 bbe35d28 00000002 00000000 win32k+0xec89
f7852cf8 bf845725 bbe35d28 bf84509a f7852d64 win32k+0x44fe8
f7852d48 bf8450b7 00000000 0012ef58 f7852d64 win32k+0x45725
f7852d58 804de7ec 32820174 0012ef68 7c90e514 win32k+0x450b7
f7852d64 7c90e514 badb0d00 0012ef54 00000000 nt+0x77ec
f7852d68 badb0d00 0012ef54 00000000 00000000 0x7c90e514
f7852d6c 0012ef54 00000000 00000000 00000000 0xbadb0d00
f7852d70 00000000 00000000 00000000 00000000 0x12ef54
STACK_COMMAND: kb
FOLLOWUP_IP:
win32k+13cf4
bf813cf4 8975cc mov dword ptr [ebp-34h],esi
SYMBOL_STACK_INDEX: 0
SYMBOL_NAME: win32k+13cf4
FOLLOWUP_NAME: MachineOwner
IMAGE_NAME: win32k.sys
BUCKET_ID: WRONG_SYMBOLS
Followup: MachineOwner
---------
kd> lmvm nt
start end module name
804d7000 806ee580 nt T (no symbols)
Loaded symbol image file: ntoskrnl.exe
Image path: ntoskrnl.exe
Image name: ntoskrnl.exe
Timestamp: Thu Dec 09 14:38:34 2010 (4D00DBDA)
CheckSum: 0022638E
ImageSize: 00217580
Translations: 0000.04b0 0000.04e4 0409.04b0 0409.04e4
kd> lmvm win32k
start end module name
bf800000 bf9c8080 win32k T (no symbols)
Loaded symbol image file: win32k.sys
Image path: win32k.sys
Image name: win32k.sys
Timestamp: Tue Sep 06 15:25:01 2011 (4E661F2D)
CheckSum: 001C948C
ImageSize: 001C8080
Translations: 0000.04b0 0000.04e4 0409.04b0 0409.04e4

#131
Posted 23 July 2012 - 03:58 AM
salman719
-

- Member
-
- 11 posts
Member
that all are good stuff for me.
thanks for the sharing.
thanks for the sharing.
#132
Posted 23 July 2012 - 04:59 AM
rshaffer61
-

- Moderator
-

- 34,114 posts
Moderator
What is 0X0000007E?
0x0000007E: SYSTEM_THREAD_EXCEPTION_NOT_HANDLED
A system thread generated an exception which the error handler did not catch. There are numerous individual causes for this problem, including hardware incompatibility, a faulty device driver or system service, or some software issues. Check Event Viewer (EventVwr.msc) for additional information.
#133
Posted 07 August 2012 - 01:26 PM
CDaug
-

- Member
-
- 4 posts
New Member
I have a Dell desktop that on boot up I get a blue screen and can't get past it. It is running Windows Xp Service Pack 3. It will boot into safe mode fine and I pulled my files I need from it onto a flash drive so at least they are safe. I have done a system restore also from safe mode but upon restart I still get the blue screen. I do not have the Windowsxp boot disk, wish I did. I think maybe it needs windows updates or probably something simple but in safe mode I am unable to connect to the internet to do any updates or troubleshooting to it.
The STOP codes are below.
0x0000007E
(oxC0000005, 0xF78A160, 0xF78E6864, oxF78E6560)
Kdcom.dll - address F78A8160 baseat F78A7000, Datestamp 4f8fof42
I looked at all the post on Stop Codes and did not see the exact one on my screen.
Any suggestions or help will be appreciated.
Thanks
The STOP codes are below.
0x0000007E
(oxC0000005, 0xF78A160, 0xF78E6864, oxF78E6560)
Kdcom.dll - address F78A8160 baseat F78A7000, Datestamp 4f8fof42
I looked at all the post on Stop Codes and did not see the exact one on my screen.
Any suggestions or help will be appreciated.
Thanks
#134
Posted 07 August 2012 - 01:29 PM
rshaffer61
-
- Moderator
-
- 34,114 posts
Moderator
0x0000007E: SYSTEM_THREAD_EXCEPTION_NOT_HANDLED
A system thread generated an exception which the error handler did not catch. There are numerous individual causes for this problem, including hardware incompatibility, a faulty device driver or system service, or some software issues. Check Event Viewer (EventVwr.msc) for additional information.
Please follow the steps below to enter the Event Viewer program in XP. This will give me more information into what is causing your issue.
Go to
Start and then click on Run
Type in eventvwr.msc and press Enter
On left side click on Applications On right side look for any RED X about the time of a incident
On left side click on System. On right side look for any Red X about the same time of a incident
Also look for any yellow exclamation mark at the same time in either of the above
If you find any double click on one at a time and take a screenshot.
To take a screenshot click on your Print Screen on your keyboard. It is normally the key above your number pad between the F12 key and the Scroll Lock key
Now go to Start
All Programs
Accessories
Paint
In the empty white area click and hold the CTRL key and then click the V
Go to the File option at the top and click on Save as
Save as file type JPEG and save it to your Desktop
Include as a attachment in your next reply
If your attachment is to big to attach then go to Mediafire .
Register and upload your file.
Then reply with the link located to the right of your now uploaded file on Mediafire
Please follow the steps below to enter the Event Viewer program in Vista\Win7. This will give me more information into what is causing your issue. You can get to Event viewer two ways and I will post both for you.
Method One
" Go to
" Start
" In the Search box type in Event Viewer in the search box and press Enter
" From this point you can follow from step four from the below method as they will be the same.
Method Two
" Go to Start
" Right click on the Computer Icon and select Manage
" Navigate to the Event Viewer, You will be prompted to accept the action you are going to perform. Click continue
" On the left window pane click on Local and then expand the Windows entry. This will allow you to see every error for the past 24 hours as well as the last 7 days in the right window pane.
" Look for the ones that correspond to the times that your issue occurred.
" If any are found please double click and expand the error. This will open and give you more information on the error.
" Please include that in your next reply.
Download WhoCrashed from the link in my signature below
This program checks for any drivers which may have been causing your computer to crash....
Click on the file you just downloaded and run it.
Put a tick in Accept then click on Next
Put a tick in the Don't create a start menu folder then click Next
Put a tick in Create a Desktop Icon then click on Install and make sure there is a tick in Launch Whocrashed before clicking Finish
Click Analyze
It will want to download the Debugger and install it Say Yes
WhoCrashed will create report but you have to scroll down to see it
Copy and paste it into your next reply
http://www.resplendence.com/downloads
#135
Posted 07 August 2012 - 03:33 PM
CDaug
-
- Member
-
- 4 posts
New Member
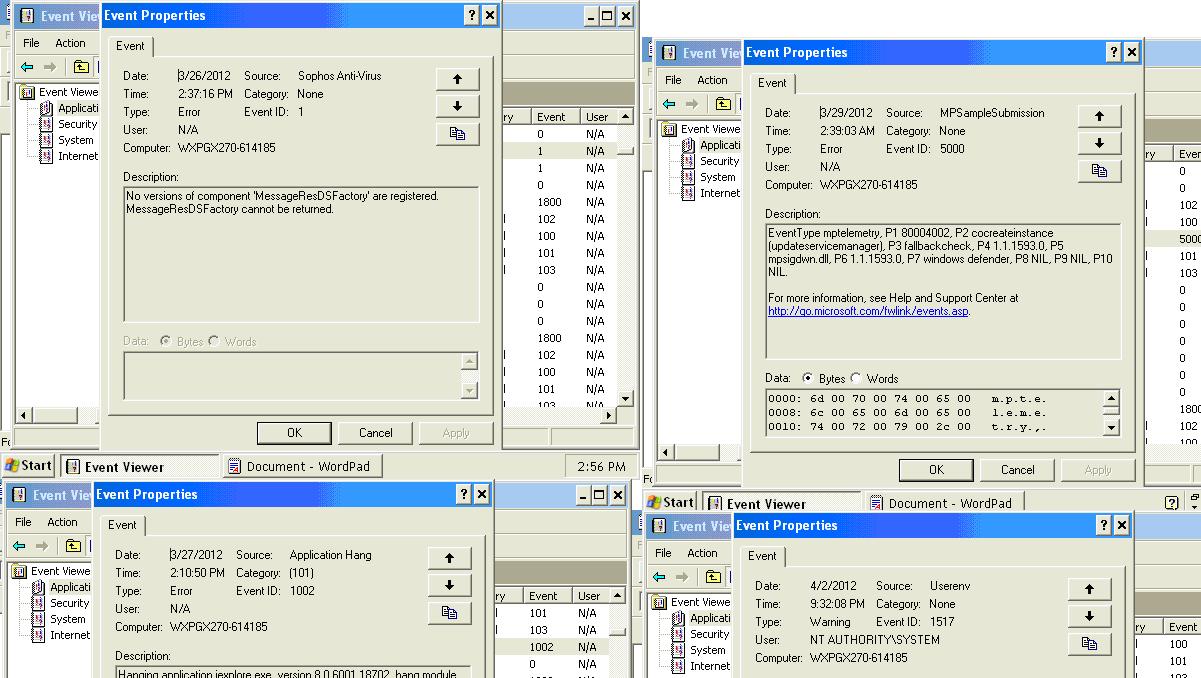
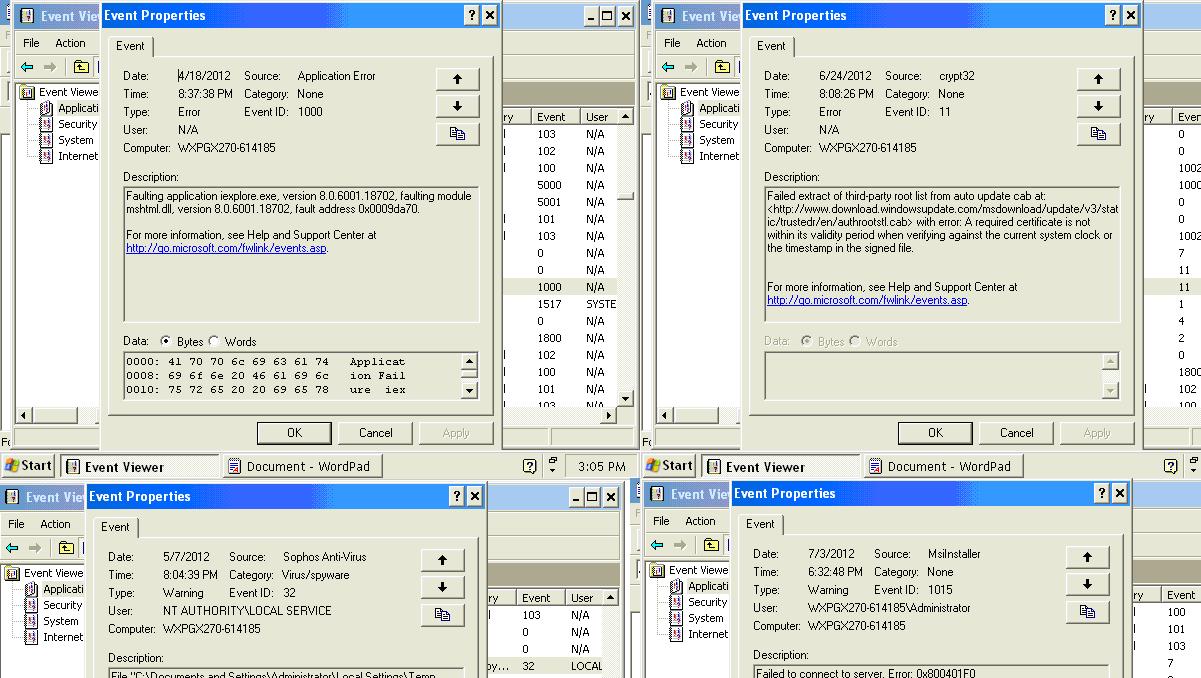
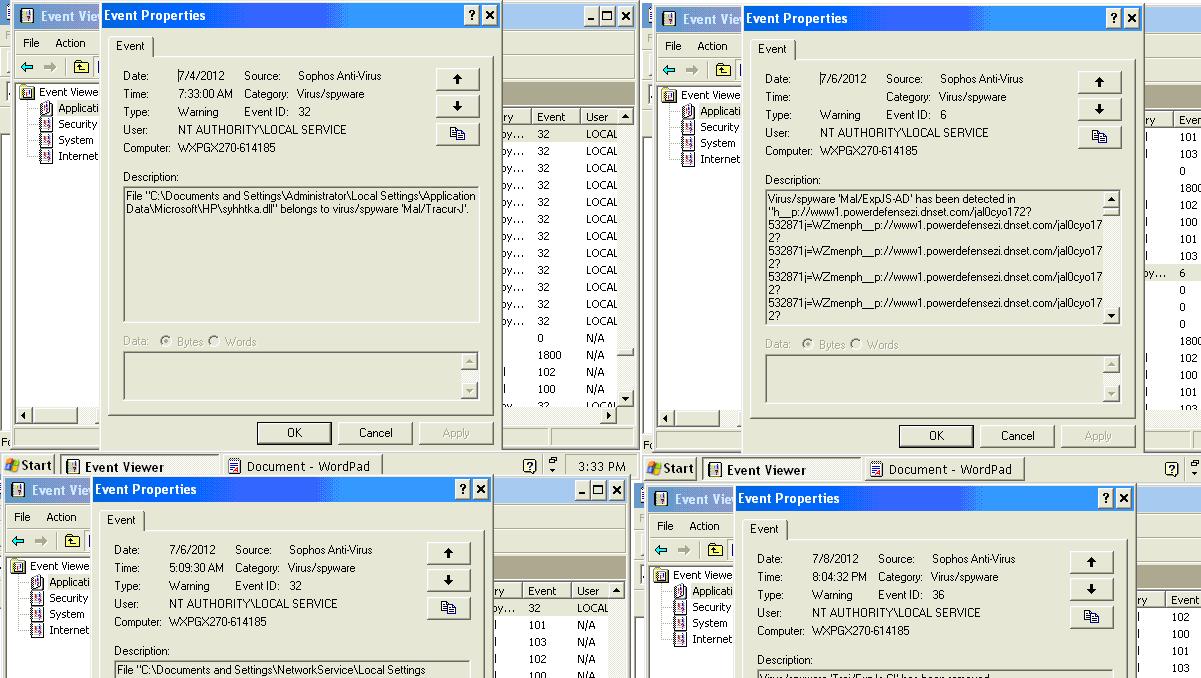
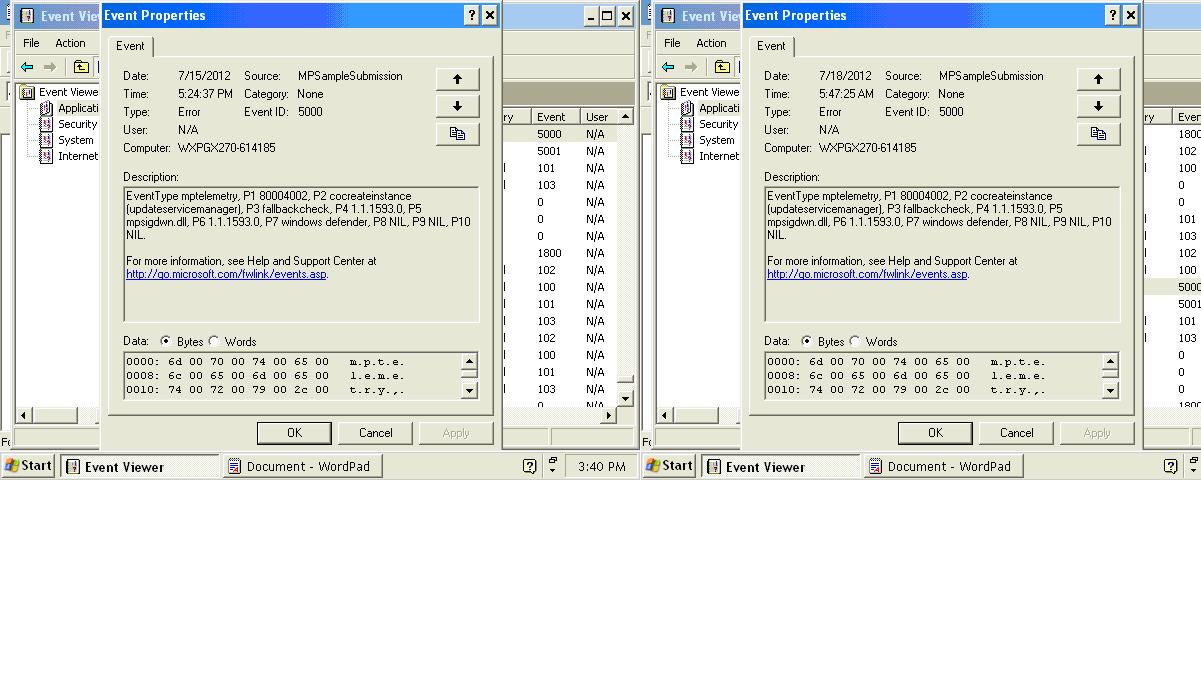
There were 112 event logs with either a Red X or a yellow warning. Most of them refered to either windows defender or my anti virus software Sophos. On the attached I copied the different events, they just repeat starting in March through mid July when the blue screen first appeared. A few weeks before the blue screen I did remove some spyware & virus my software caught (I assume it caught it all) and also removed some toolbars I did not know were installed. As the toolbars were causing unwanted random pictures to appear when on the internet.
Let me know if you need other information. The Os Windows XP Professional addition in case that helps.
Thanks,
Let me know if you need other information. The Os Windows XP Professional addition in case that helps.
Thanks,
Attached Thumbnails


Similar Topics
2 user(s) are reading this topic
0 members, 2 guests, 0 anonymous users
As Featured On:


 Sign In
 Create Account
